An app is considered to have poor performance if it responds slowly, shows choppy animations, freezes, or consumes too much power. Fixing performance problems involves identifying areas in which your app makes inefficient use of resources such as the CPU, memory, graphics, network, or the device battery. Android Studio offers several profiling tools to help find and visualize potential problems.
Setting up Android Studio :
1.Download and Install the .exe file from Android Studio:
https://developer.android.com/studio
2.Select the checkboxes and Install SDK platforms:

3.Verify whether by default check marked SDK tools are installed:

4.Setup Environmental Variables for Android Studio:
->Create a new Variable “ANDROID_HOME” under system Variables
For example, value will be C:\Users\Ranjith\AppData\Local\Android\Sdk
->Add below paths under system Variables
%ANDROID_HOME%\platform-tools
%ANDROID_HOME%\tools
%ANDROID_HOME%\tools\bin
5. Profileable should be done before releasing the APK file by Developers. A profileable APK is essentially a release APK with a line of <profileable android:shell="true"/> added within the <application> section of the manifest file.
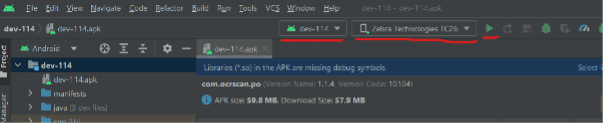
6.Open the apk file from Android Studio:

7.Connect the real device and click on Run to install and open the application on real device by Android Studio:
8.Once the app is installed and opened Navigate to Profiler tab to see CPU, Memory and Energy consumption. If Profiler doesn't connect to an app process automatically, you may need to select an app process manually( “+” icon against Sessions):
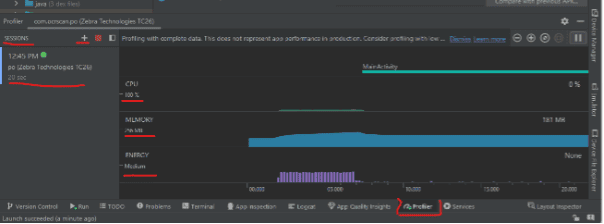
9.To see detailed consumption and record it, click on each section to navigate into it:
CPU : helps track down runtime performance issues:

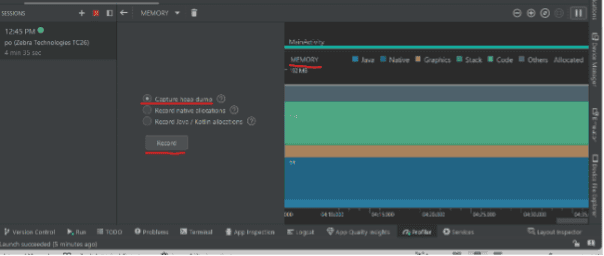
MEMORY : helps track memory allocations:
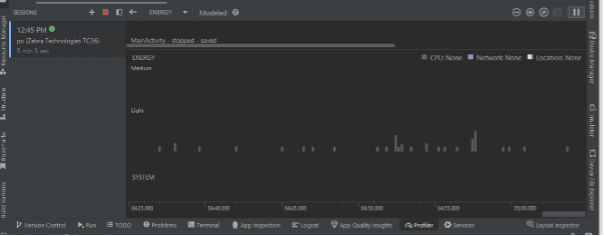
ENERGY: tracks energy usage, which can contribute to battery drain:
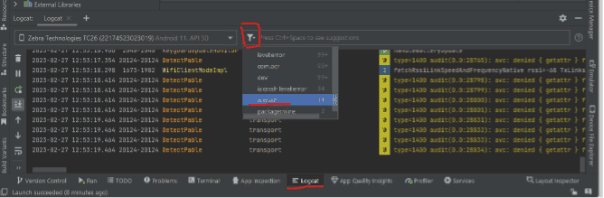
10. The Logcat window in Android Studio helps you debug your app by displaying logs from your device in real time—for example, messages that you added to your app with the Log class, messages from services that run on Android, or system messages, such as when a garbage collection occurs. When an app throws an exception, Logcat shows a message followed by the associated stack trace containing links to the line of code. It even captures the crashlogs whenever an app crashes: